
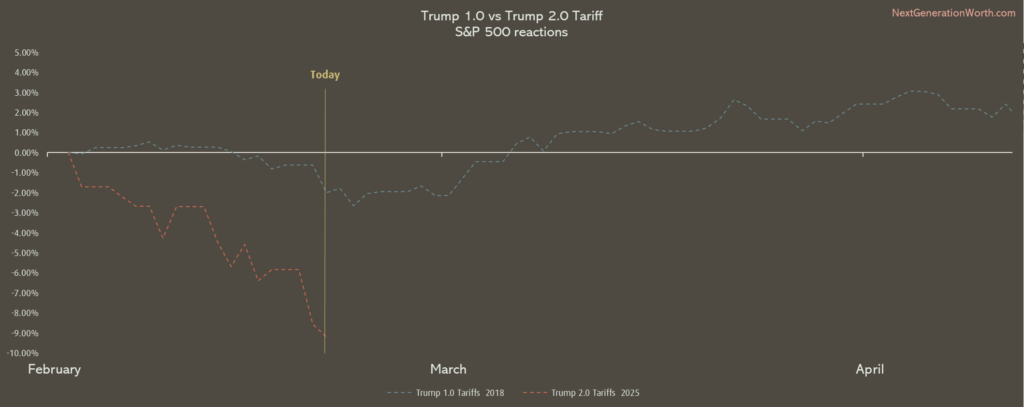
The market’s reaction to tariff implementations has been a significant indicator of investor sentiment and economic expectations. The chart comparing Trump 1.0 and Trump 2.0 tariffs showcases a clear correlation between the imposition of tariffs and S&P 500 daily returns, with the latter period appearing to be more volatile and reactive.
Tariff 1.0: The 2018 Trade War Shock
The first wave of tariffs under the Trump administration took effect on June 6, 2018. This marked the beginning of a trade war primarily aimed at China, with tariffs imposed on $50 billion worth of Chinese goods, later escalating to $250 billion by the year’s end. The sectors targeted included technology, steel, aluminum, and agriculture, leading to retaliatory tariffs from China. The stock market reacted negatively, as seen in the downward trend on the chart. The S&P 500 experienced a steep decline during the initial phase, as uncertainty over trade relations and economic growth loomed.
However, despite the initial shock, the market eventually stabilized as negotiations progressed and businesses adapted to the new trade landscape. By early 2019, the S&P 500 had recovered much of its losses, demonstrating the market’s ability to adjust to new realities over time.
Tariff 2.0: A More Aggressive Approach
Fast forward to February 20, 2025, the return of Trump to office ushered in an even more aggressive tariff policy. Unlike in 2018, when tariffs were imposed gradually, this time, they were implemented at a much faster and broader scale. This immediate and forceful approach caused a sharper initial drop in the S&P 500, as seen in the chart. The primary sectors affected include automobiles, semiconductors, and consumer goods, leading to concerns over inflation and supply chain disruptions.
Unlike the 2018 tariffs, which were focused on China, the 2025 tariffs extend to European and Latin American countries, further heightening global trade tensions. The market’s initial reaction suggests a higher sensitivity compared to the first tariff wave, potentially due to the drastic change in political ideology and economic priorities.
Overreaction or Real Concern?
While the initial reaction in 2018 was followed by a recovery, the 2025 response appears more extreme. This could indicate a market overreaction, but also a genuine concern over economic stability. Investors should consider whether this selloff presents an opportunity rather than a reason to panic. Historically, recession fears often lead to short-term volatility, but the key is reading between the lines.
Recessions are talked about, but history shows that the best opportunities arise when sentiment is at its lowest. Following the mass sentiment often leads to missed investment opportunities, while contrarian views tend to be rewarded over time.
The correlation between these two tariff periods suggests that markets react negatively in the short term, but the long-term impact depends on how businesses and policymakers adapt. While the 2025 tariffs are more aggressive, they could lead to increased domestic investment and reshoring in the long run. Investors should remain cautious but also open to potential opportunities.
Disclaimer: This is not financial advice. Do your own research (DYOR).